If you are running PPC ads you are probably know how inconvenient to analyze the campaign’s performance in Google Ads account, especially if you want to share your insights with a client or stakeholder. That’s why I recommend you use Google Data Studio for this purpose.
In Data Studio you can create stunning dashboards that can be easily understandable even for non-tech-savvy users. And the best of all it’s 100% free.
In this article, I’ll share with you my free Google Data Studio PPC Dashboard that you can use to analyze your Google Ads data.
Video Tutorial
If it’s more convenient for you to understand the information in the video format I put together a video that explains all dashboard features.
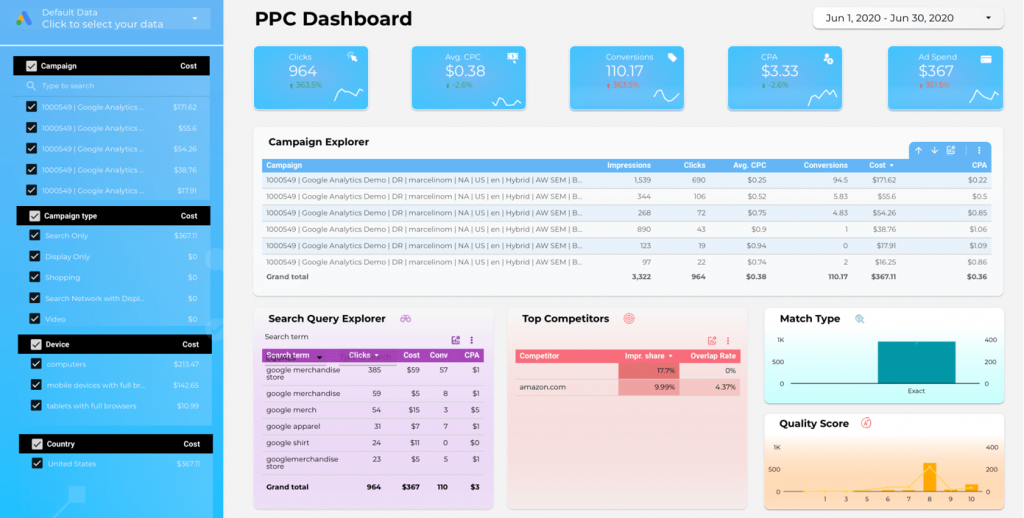
PPC Dashboard Structure
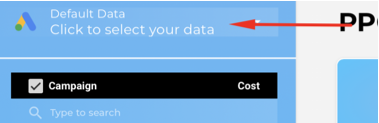
Account Selector
The first thing that you need to do is to select your Google Ads account in the upper left-hand corner. If you see a Sign-In button, you’ll need to login into your account and refresh the report. And if you have several google accounts that you are logged into at the same time you can switch between accounts if you hover in the right-hand corner and choose the appropriate one. If it does not work, you can use a different browser to view your data.
You may be wondering: “Is my data secure?”
Absolutely. Data Studio is owned by Google that’s why it provides “seamless” integration with Google Ads. The report does not share any google ads data with me. You are privately viewing your own account data only.
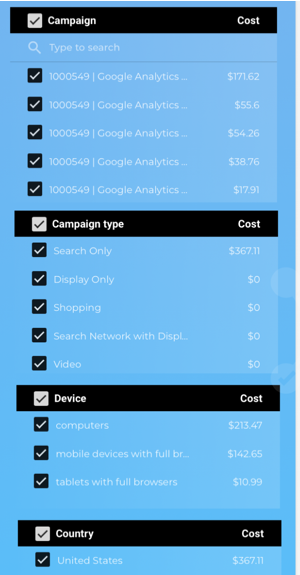
Filters
Below the account selector, you can observe dashboard filters for Campaign, Campaign type, Device, and Country selection. You can specify which type of campaign you want to explore and so on.
Also, you can see how much money you’ve spent on a particular campaign, device, or country.
Hint. When you choose the account from the dropdown menu data studio pushes the query parameter (account id) to the dashboard URL, and you can bookmark this page to save the previously selected account. The same is true for filters. For instance, you can select account 1 + the US or account 1 + the UK or account 1 + display + the US and bookmark each view separately to quickly access your data.
Scorecards + Date Range
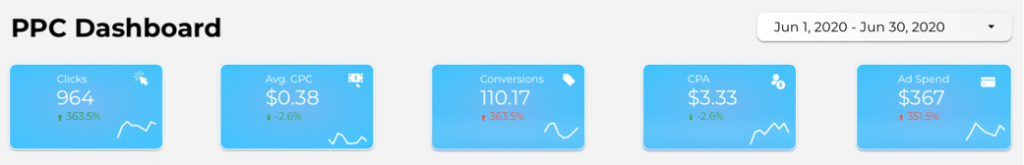
The purpose of the upper section of the PPC dashboard is to display the main KPIs of your business. You can see and compare how your CPC, clicks are changing over time.
Besides, you can adjust the date range for the dashboard in the top right corner.
Campaign Explorer
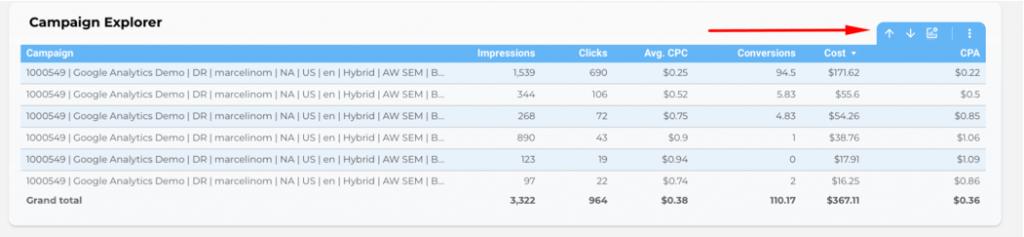
The middle section of the dashboard is showing your campaign performance. The table chart is highly customizable. You can add/remove some columns to see the data that you need.
Additionally, you can drill up and down to explore your campaign/ad group/keyword-level data.
Search Query Explorer
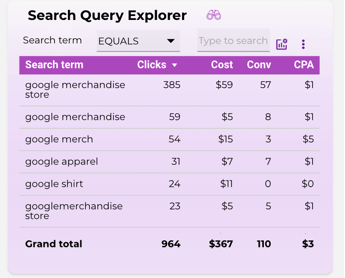
The third section is about search query explorer, top competitors, match type, and quality score. Search query explores is showing what keyword people type before they jump on your website. Optional metrics are also available here. Moreover, you can filter your search terms by typing your keywords.
Top competitors
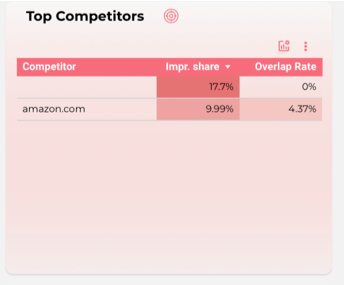
Top competitors provide insights about who are your competitors in PPC, their impression share, overlap rate, also you can investigate avg position and outranking share.
If you see the blank cell in the competitor tab it means that it’s your website. That is how gds displays your data.
Match Type + Quality Score
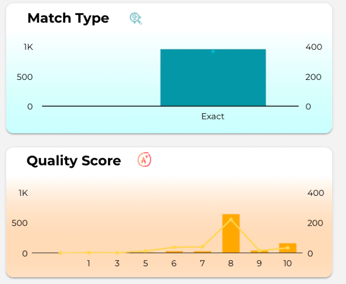
Match type is showing the breakdown by the broad, exact, phrase match, and how much you spent for a specific match type as well how many clicks you received.
The quality score is showing how good your ads are optimized.
If you hover on the chart you can see the number of clicks and ad spend.
Summary
I hope that this article was useful to you.
If so, please share it with your professional network and if you have any questions/suggestions leave me a message below.
You can find a link to the dashboard below.
Web Analytics Configuration for premium Shopify brand – Fleurdumal – Case Study
About the client Fleurdumal is a high-end D2C brand that offers a range of exquisite…
Reporting Automation for lingerie eCommerce brand – MarieMur – Case Study
About the client MarieMur is a US premium D2C Shopify brand that sells luxury lingerie….
The New Native Google Analytics 4 (GA4) Integration for Shopify
https://youtu.be/tJMutKpRCXY